Projects.
Here are my personal and professional projects, where personal projects are available publicly.
Discovery of Photonic Band Inversion Method
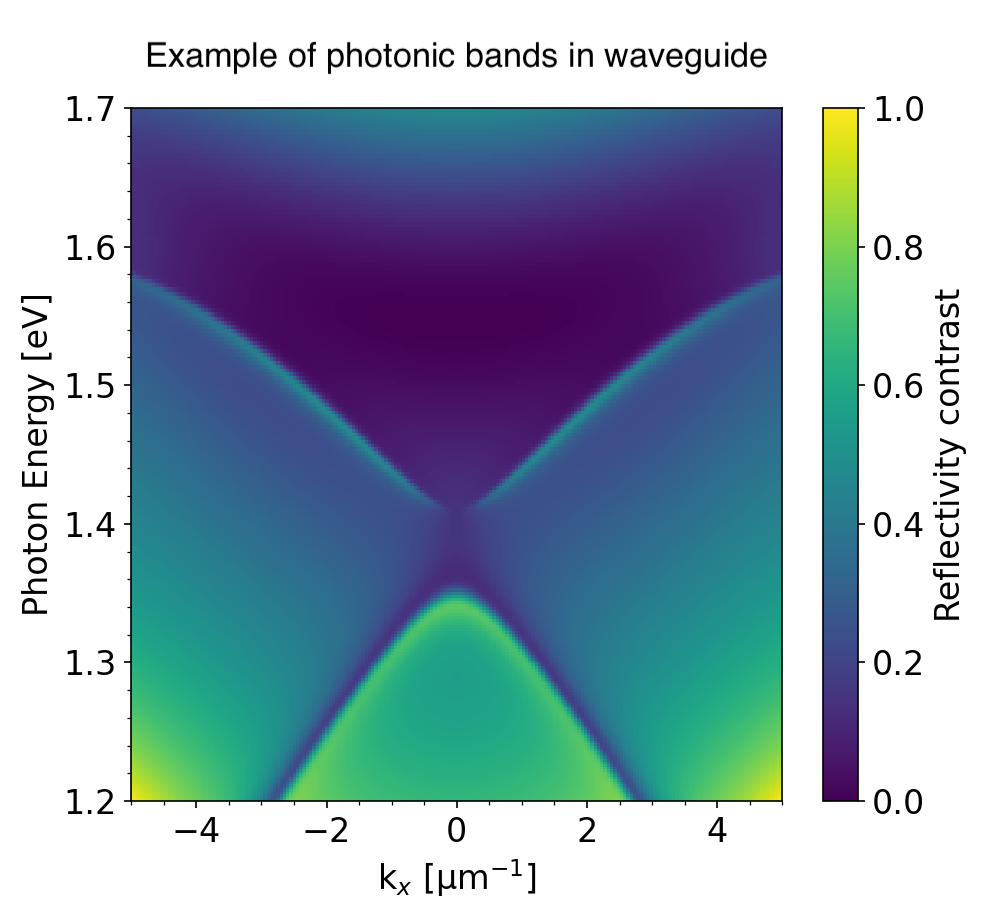
During my final year project, researching dependence of photonic bands in a waveguide on geometric grating parameters, I discovered a novel method of photonic band inversion that is more easily constructed than existing methods, with existing lithography techniques. Python RCWA simulations investigating oblique light incidence allowed identification of photonic band inversion in aperiodic waveguides, with intriguing properties. Strong Python ability, photonics intuition and research skills enabled me to advance photonics research, opening the door for highly tunable topological edge states in miniaturised photonic devices.
WPF App (.NET 8) for Calculation of Radiance-Temperature Relationship for Digital Radiometric Optical Devices
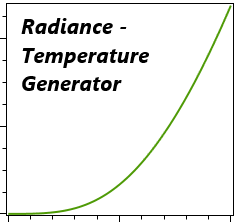
Created a C# app using the WPF framework that calculates the Radiance Temperature relationship for a given wavelength band, temperature range, and filter using the Sakuma Hattori Planck 3 approximation to calculate thermal radiation. SQLite database management module created to manage filters, which can be stacked to simulate a non-transparent beam path. Resulting relationship downloadable as CSV. More details on GitHub.
This Website - Responsive Design using Modern Frameworks

After noticing my Wordpress site was very bloated and slow, I created my own, using Next.js (React based), Tailwind CSS and Headless UI. I chose to use TypeScript .tsx files to return HTML blocks, rather than using default DOM based interaction. Using a React.js based framework means the page navigation system couples with this well. Overall, an enjoyable project to extend web development experience. More details on GitHub.
LSTM based Machine Learning of Motor Activity for Prediction of Depression without Clinical Diagnosis
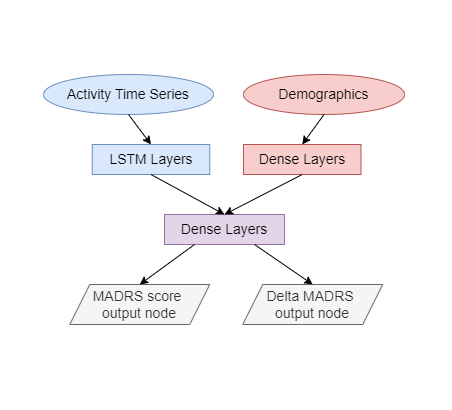
Trained a dual-branch multilayer neural network using LSTM RNN and Dense Layers using tensorflow and scikit-learn to predict MADRS depression score, using activity from an Actigraph watch. With 30% test split, MADRS score prediction MAE < 1%, and the prediction for change in score was also < 1% (percentage based on input data range rather than possible metric values). Interestingly, demographic data seems to be a stronger predictor than the LSTM network, so I plan to investigate if only LSTM can be used as this would ultimately be more useful. Given the amount of smart devices around, there is excellent potential for scalability. More details on GitHub. ‘Depresjon’ dataset from Simula.
Stock Price Prediction ML Pipeline featuring FastAPI and Streamlit dashboard

This project allowed me to practice making a local machine learning (LSTM) pipeline, using FastAPI for Rested data access, and Streamlit for an interactive dashboard. Docker setup is also introduced, however Docker is now unsupported on my device so is untested. This would make cloud hosting possible, and is better for running on different devices. During the project, I learned a lot about Rested backend design, limitations of LSTM models (e.g. poor volatility prediction causing R^2 of 0), network structure, and the use case for making a container to run the app. More details on GitHub.
Exploratory Data Analysis of Go-Karting Times
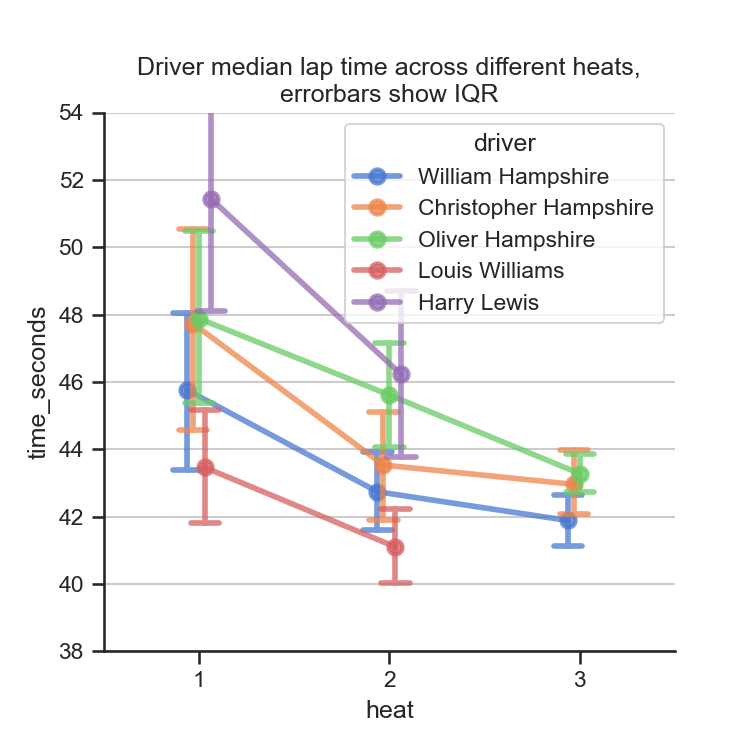
TeamSport Karting send an email after each heat/session containing the lap times of your session. This provided an opportunity to use what I have learned so far in the Data Science track on DataCamp in an area I am interested in. I asked my family what they would like to find out, and implemented data engineering, EDA, and visualisation leveraging powerful features of pandas and seaborn to answer their questions, wrangling and processing the data to provide effective visualisations. More details on GitHub.
Sheffield 2024 Local Election – Data Scraping to Viz
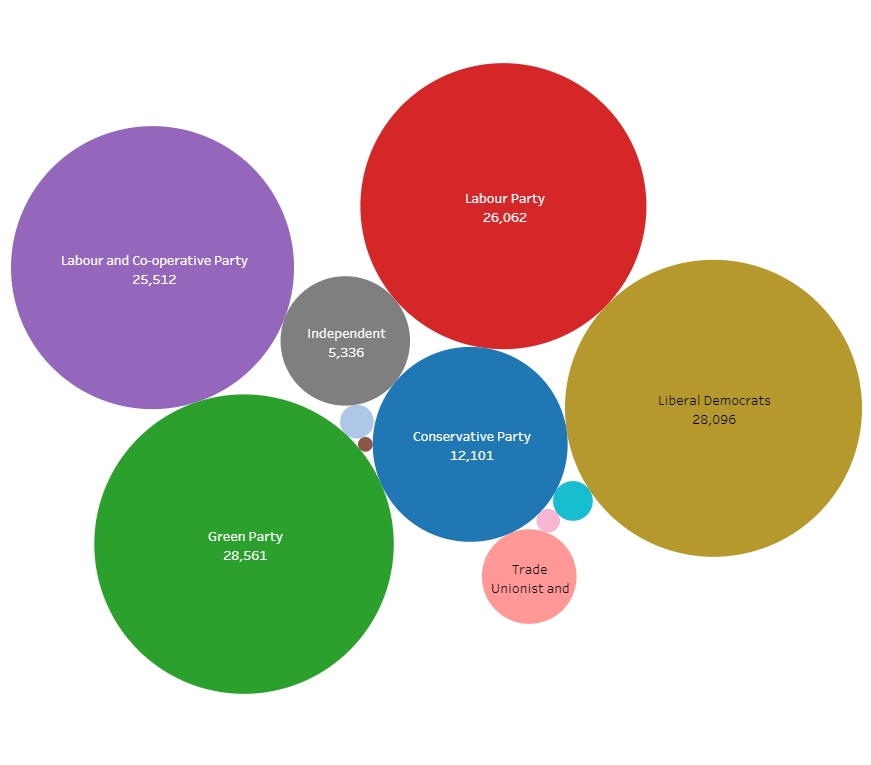
After reading the 2024 Sheffield local election results, I thought they could be more inviting and insightful if visualised. So, I copied the HTML source into a local .txt (avoids use of bots), and performed data scraping and querying, using Python and SQLite. I then visualised in Tableau (example image shows total party votes). Project files & direction can found in my GitHub repository, where anyone can further interrogate the data.
Python Data Mining Scripts (professional)

Used to verify instrument quality in 7 figure orders, I coded 5 data mining scripts, using numpy, pandas, and more, for my company. Enhanced quality control using statistical methods, able to identify anomalies efficiently and determine effective & reasonable pass/fail thresholds. Over 30,000 records, formatted as .html, .pdf and .txt, scraped in total. I expect this to improve product quality significantly as witnessed for the foreseeable future, increasing the business' products reputation.
Levant Region Land Ownership Over Time – Tableau Viz
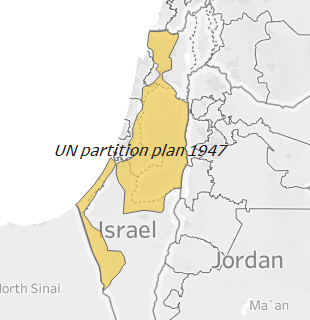
I thought it would be interesting to collate data from multiple maps, digitising to shapefiles using QGIS, to show ownership of the land in the Levant region (specifically modern day Israel/Palestine area) in coarse steps from 1000BC (there were many empires that ruled in between the largest gap). This Tableau dashboard allows the user to investigate the land ownership over time, and speculate on complex and nuanced factors contributing to ongoing modern conflicts.
Rest API website client (professional)

Created an example website to demonstrate and for clients to build upon using HTML, CSS and – mostly – JavaScript, showing the capabilities of connecting to instruments using Rest API. This includes displaying a live image via http GET requests, PUT requests, sending queries for specific regions (ROIs) retrieving minimum, maximum and average values within, and more. This work supports the move towards IoT systems of devices, and allowing many-to-many connectivity very easily, meaning many different devices can be used with one system on multiple clients.